
If you are looking for MEC-109 IGNOU Solved Assignment solution for the subject Research Methods in Economics, you have come to the right place. MEC-109 solution on this page applies to 2023-24 session students studying in MAEC courses of IGNOU.
MEC-109 Solved Assignment Solution by Gyaniversity
Assignment Code: MEC-109/AST/2023-24
Course Code: MEC-109
Assignment Name: Research Methods in Economics
Year: 2023-2024
Verification Status: Verified by Professor
SECTION-A
Answer the following questions in about 700 words each. Each question carries 20 marks.
Q1) ‘The inductive strategy begins with the collection of data from which generalization is made’- In the light of this statement formulate a research proposal indicating the various steps involved in research process.
Ans)
Research Proposal: Understanding the Impact of Social Media Usage on Adolescent Mental Health
a) Introduction:
The pervasive influence of social media on contemporary society, especially among teenagers, has raised significant concerns about its potential impact on mental health. Social media platforms have become integral to the daily lives of teenagers, shaping their interactions, self-perception, and overall well-being. As digital connectivity continues to grow, understanding the intricate relationship between social media usage and teenagers' mental health becomes crucial.
The rising concerns stem from the intricate ways in which social media can influence adolescents' psychosocial development. Exposure to idealized images, cyberbullying, and the constant pressure to conform to online standards can contribute to heightened stress and mental health challenges among teenagers. Consequently, a comprehensive investigation into the impact of social media on their mental health is essential to inform stakeholders and implement effective interventions.
b) Research Question:
The research question that guides this study is: "What is the impact of social media usage on the mental health of teenagers?" This question encapsulates the multidimensional nature of the inquiry, acknowledging that the relationship between social media and mental health is complex and requires a nuanced examination.
c) Objectives:
1) Investigate the patterns of social media usage among teenagers:
i) Explore the frequency and duration of social media engagement.
ii) Identify the types of content consumed and shared.
2) Examine the correlation between social media activities and mental health indicators:
i) Analyse the association between social media usage patterns and mental health outcomes.
ii) Assess the prevalence of stress, anxiety, and depression among teenagers in relation to their social media behaviours.
3) Identify potential factors that mediate or moderate the relationship:
i) Explore factors such as parental involvement, peer support, and online safety practices that may influence the impact of social media on mental health.
d) Literature Review:
The existing body of literature reveals a dynamic landscape of research on the relationship between social media and teenagers' mental health. Studies have consistently highlighted the potential negative consequences, including increased stress, body image concerns, and the exacerbation of existing mental health conditions. However, methodologies vary, and there are gaps in understanding the nuanced mechanisms that underlie these associations. Relevant theories, such as the social comparison theory and the self-esteem model, provide frameworks for comprehending how social media influences adolescents' perceptions of themselves and their peers.
e) Theoretical Framework:
Building on the literature review, the theoretical framework for this study incorporates the social comparison theory and the self-esteem model. The social comparison theory posits that individuals determine their own social and personal worth based on how they stack up against others. In the context of social media, constant exposure to curated and idealized content can contribute to social comparison processes, impacting teenagers' self-esteem and mental well-being. The self-esteem model suggests that social media usage may influence adolescents' self-esteem, with the potential for both positive and negative outcomes.
f) Methodology:
1) Participants: The target population includes teenagers aged 13-18, representing the diverse socio-economic backgrounds found in schools. Employing random sampling ensures a representative sample, capturing the heterogeneity of social media usage patterns and mental health experiences.
2) Data Collection: Utilizing a mixed-methods approach allows for a comprehensive understanding. Surveys gather quantitative data on social media habits, mental health indicators, and potential confounding variables. Interviews and focus groups offer qualitative insights, capturing the subjective experiences and perceptions of teenagers.
3) Instruments: A structured questionnaire will cover a range of topics, including social media usage patterns, mental health indicators, and relevant demographics. Interview and focus group protocols will employ open-ended questions to delve into nuanced experiences and allow participants to express their perspectives freely.
4) Ethical Considerations: Obtaining informed consent from both participants and their parents ensures transparency and respect for autonomy. Confidentiality measures are implemented to protect privacy, and proactive steps are taken to minimize potential psychological distress, providing contact information for support services if needed.
g) Data Analysis: Quantitative data analysis involves employing statistical techniques such as correlation and regression to examine the relationships between social media usage patterns and mental health indicators. Thematic analysis is used for qualitative data, identifying recurring themes and patterns within participants' narratives.
h) Results and Discussion: The presentation of findings includes visual representations, offering a clear overview of the quantitative and qualitative results. The discussion delves into the implications of the findings, considering how they align with existing literature, addressing limitations, and suggesting directions for future research.
Q2. Distinguish between Cluster sampling and Multi-stage sampling. In order to find out the incidence of Malnutrition among rural households in a given distinct, how would you collect the data by multi-stage sampling? Illustrate.
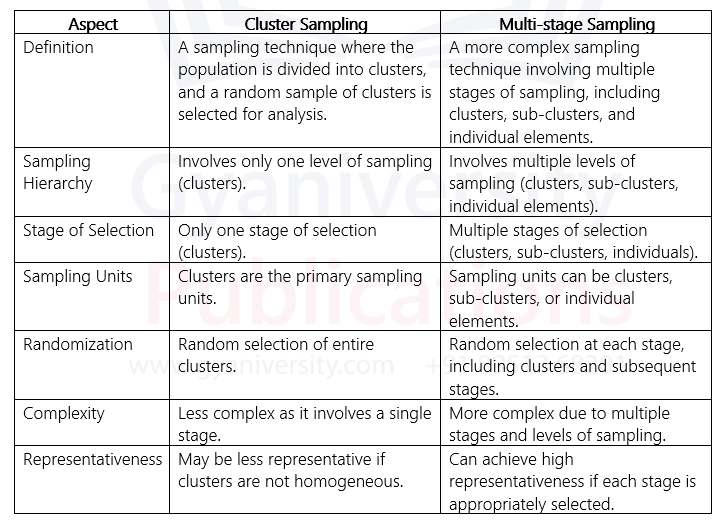
Multi-stage sampling is a method used in survey research to gather data from large populations efficiently and effectively. It involves dividing the population into smaller, more manageable groups or stages, and then selecting samples from each stage to represent the entire population. In the context of finding out the incidence of Malnutrition among rural households in a given district, multi-stage sampling can be an appropriate method. Here's how the process could be carried out:
Stage 1: Selection of Primary Sampling Units (PSUs)
a) The first stage involves selecting primary sampling units (PSUs), which are typically large geographic areas such as villages or townships within the district. The selection of PSUs should be done in a way that ensures they are representative of the entire district.
b) Geographic Division: Divide the district into smaller geographic units, such as villages or townships. Ensure that these units cover the entire geographical area of the district and are heterogeneous in terms of socio-economic characteristics.
c) Sampling Frame: Create a sampling frame listing all the villages or townships in the district. This list should be comprehensive and up-to-date.
d) Random Selection: Use random sampling techniques to select a certain number of PSUs from the sampling frame. This ensures that every village or township in the district has an equal chance of being selected.
Stage 2: Selection of Secondary Sampling Units (SSUs)
a) Once the PSUs have been selected, the next stage involves selecting secondary sampling units (SSUs) within each PSU. SSUs could be households or individuals, depending on the research objectives.
b) Household Listing: In each selected PSU, create a list of households. This list should cover all households residing in the selected PSUs.
c) Systematic Sampling: Use systematic sampling to select a random sample of households from each selected PSU. Systematic sampling involves selecting every nth household from the household listing, where n is calculated based on the total number of households and the desired sample size.
d) Inclusion Criteria: Define clear inclusion criteria for households to ensure that the selected sample is representative of the population of interest. For example, inclusion criteria could include households with children under the age of five or households below the poverty line.
Stage 3: Data Collection
a) Once the sample households have been identified, data collection can begin. Various methods can be used for data collection, including household surveys, interviews, and observations.
b) Structured Questionnaires: Develop structured questionnaires to collect data on various socio-economic indicators, dietary habits, access to healthcare, and nutritional status of household members.
c) Trained Enumerators: Train enumerators to administer the questionnaires and collect data from selected households. Enumerators should be familiar with the local language and culture to ensure effective communication with respondents.
d) Anthropometric Measurements: In addition to surveys, conduct anthropometric measurements to assess the nutritional status of household members, especially children under the age of five. Measurements such as height, weight, and mid-upper arm circumference can provide valuable information about malnutrition prevalence.
e) Data Validation: Validate collected data through regular monitoring and quality control measures to ensure accuracy and reliability.
Stage 4: Data Analysis and Interpretation
a) Once data collection is complete, the collected data needs to be analyzed to draw meaningful conclusions about the incidence of malnutrition among rural households in the district.
b) Descriptive Analysis: Conduct descriptive analysis to summarize key findings and demographic characteristics of the sample population.
c) Statistical Analysis: Use appropriate statistical techniques to analyze the relationship between various factors such as household income, education level, access to healthcare, and nutritional status.
d) Comparison: Compare the prevalence of malnutrition across different demographic groups and geographical areas within the district to identify disparities and patterns.
Interpretation: Interpret the findings in the context of existing literature and local socio-economic conditions. Discuss implications for policy and program development aimed at addressing malnutrition in rural areas.
SECTION B
Answer the following questions in about 400 words each. The word limits do not apply in case of numerical questions. Each question carries 12 marks.
Q3) Suppose you want to study the behaviour of sales of automobiles over a number of years and someone suggests you try the following models:
yt= B0 + B1 t
yt= à0 + à1 t + à2 t2
Where yt = sales at time t and t = time. The first model postulates that sales is a linear function of time, whereas the second model states that it is a quadratic function of time.
(a) Discuss the properties of these two models.
Ans)
Linear Model (yt = B0 + B1t)
a) Linearity: The model assumes a linear relationship between time (t) and sales (yt). This implies that for each unit increase in time, the change in sales is constant.
b) Intercept (B0): Represents the estimated initial sales at time zero. It is the y-intercept, indicating the baseline level of sales when time is zero.
c) Slope (B1): Represents the rate of change in sales per unit change in time. It indicates the direction and steepness of the linear trend over time.
d) Assumption: Assumes a constant and consistent linear trend in sales over time.
Quadratic Model (yt = à0 + à1t + à2t^2)
a) Non-Linearity: The model introduces a quadratic (parabolic) relationship between time and sales. It implies that the rate of change in sales is not constant but follows a curved trajectory.
b) Intercept (à0): Represents the estimated initial sales at time zero, similar to the linear model.
c) Linear Coefficient (à1): Represents the rate of change in sales per unit change in time, but it's now the linear component of the quadratic equation.
d) Quadratic Coefficient (à2): Represents the rate of change in the rate of sales growth over time. It indicates whether the sales acceleration or deceleration is occurring.
e) Turning Point: The point at which the quadratic equation reaches its maximum or minimum, indicating a shift in the direction of sales growth.
f) Assumption: Assumes a changing rate of sales growth, allowing for periods of acceleration and deceleration.
Comparison
a) Flexibility: The linear model assumes a constant rate of change, suitable for trends that exhibit linear growth or decline. The quadratic model, with its added term, allows for more flexibility to capture non-linear patterns in sales behaviour.
b) Interpretability: The linear model provides a straightforward interpretation of the slope as a constant rate of change. The quadratic model introduces additional complexity with the quadratic coefficient, making it slightly more challenging to interpret.
c) Prediction: The quadratic model may provide a better fit if there are periods of accelerating or decelerating sales, capturing a more realistic representation of sales behaviour over time.
d) Trend Identification: The quadratic model can help identify turning points in sales trends, crucial for understanding shifts in consumer behaviour.
Choosing between the linear and quadratic models depends on the nature of the sales data. If there is a clear linear trend or a need for simplicity, the linear model may suffice. However, if the sales behaviour exhibits curvature or changing growth rates, the quadratic model can offer a more nuanced representation. It is often recommended to evaluate the goodness of fit and predictive performance of each model before making a final selection.
Q3b) How would you decide which model is appropriate between these two models?
Ans)
Deciding Between Linear and Quadratic Models
Choosing between a linear and a quadratic model involves assessing the goodness of fit and the complexity of the models. Here are steps to decide which model is appropriate:
a) Visual Inspection: Plot the sales data against time and visually inspect the graph. If there is a clear curvature or non-linear pattern, the quadratic model might be more appropriate. If the relationship appears linear, the linear model may suffice.
b) Evaluate Residuals:
1) Fit both the linear and quadratic models to the data.
2) Calculate the residuals (the differences between observed and predicted values) for each model.
3) Plot the residuals against time. If there is a pattern in the residuals for the linear model (e.g., systematic deviations), it might indicate that the linear model is not capturing the underlying pattern.
c) Statistical Tests:
1) Use statistical tests to compare the models. For example:
i) F-test: Compare the goodness of fit between the two models. A significant F-test suggests that one model significantly outperforms the other.
ii) t-test: Evaluate the significance of individual coefficients in the quadratic model. If the quadratic coefficient (à2) is not statistically different from zero, the linear model might be preferred.
d) Information Criteria: Use information criteria such as AIC (Akaike Information Criterion) or BIC (Bayesian Information Criterion) to compare the models. Lower values indicate a better balance between goodness of fit and model complexity.
e) Model Simplicity: Consider the principle of parsimony. If the quadratic model does not significantly improve the fit and the linear model is simpler, the linear model may be more appropriate, especially if interpretability is a priority.
f) Cross-Validation: Split the data into training and testing sets. Fit both models on the training set and assess their performance on the testing set. This helps evaluate how well each model generalizes to new data.
g) Expert Knowledge: Consider domain expertise and insights. If there are known factors or events that could lead to non-linear trends, the quadratic model might be more justifiable.
h) Residual Analysis: Examine the residuals of both models. If the residuals for the quadratic model show patterns or heteroscedasticity, it may indicate that the model is not capturing the true underlying relationship.
i) Business Context: Consider the practical implications of each model. If a linear model is easier to explain and aligns with business expectations, it might be preferred.
Deciding between the linear and quadratic models involves a combination of statistical analysis, visual inspection, and domain expertise. It's crucial to balance model fit with simplicity, avoiding overfitting. Ultimately, the appropriateness of the model depends on the characteristics of the sales data and the insights gained from a comprehensive analysis.
Q3c) In what situation will the Quadric Model be useful.
Ans) The quadratic model, represented by yt=α0+α1t+α2t2 , is useful in situations where there is a belief or observation that the relationship between the dependent variable (in this case, sales of automobiles, yt) and the independent variable (time, t) is not purely linear but exhibits curvature or changing rates of growth. Here are situations where the quadratic model may be appropriate and useful:
a) Changing Rates of Growth: When there is a belief that the rate of growth or decline in sales is not constant over time. The quadratic term (α2t2) allows for capturing accelerating or decelerating patterns in sales.
b) Curved Trajectory: If the relationship between time and sales exhibits a curved trajectory rather than a straight line. For example, if there are periods of rapid sales growth followed by a slowdown, a quadratic model can better represent this non-linear behaviour.
c) Turning Points: When there is an expectation of turning points in the sales trend. The quadratic model allows for identifying the time at which the growth rate is maximized or minimized, indicating potential shifts in the direction of sales.
d) Seasonality and Cyclic Patterns: In situations where seasonality or cyclic patterns are present, the quadratic model can capture these non-linear variations more effectively than a linear model.
e) Product Lifecycle: In industries where products have distinct lifecycles (e.g., introduction, growth, maturity, decline), a quadratic model might be suitable for capturing the changing dynamics of sales over the product's lifecycle.
f) Consumer Behaviour Changes: If there are known changes in consumer behaviour over time that cannot be adequately represented by a linear trend, the quadratic model provides a more flexible framework.
g) Economic Factors: When economic factors or external events lead to non-linear impacts on sales, a quadratic model can help account for these complexities.
h) Response to Marketing Strategies: In scenarios where the effectiveness of marketing strategies changes over time, the quadratic model can capture how the impact of marketing efforts evolves, reflecting a more dynamic relationship.
i) Limited Resources: If resources for data collection are limited, and a quadratic model provides a good fit without the need for more complex models, it can be a pragmatic choice.
It's essential to note that the decision to use a quadratic model should be guided by a thorough analysis of the data, including visual inspection, statistical tests, and consideration of the underlying business or economic context. While the quadratic model offers flexibility, it should not be applied indiscriminately, and its use should be justified based on the characteristics of the sales data and the objectives of the analysis.
Q4) Try to obtain data on automobile sales from any company in India over the past 20 years and examine which of the two models (Linear and Quadric) fits the data better?
Ans)
Examining Automobile Sales Trends of Tata Motors: Linear vs. Quadric Models
The past 20 years of automobile sales (passenger vehicles) for Tata Motors, a prominent Indian car manufacturer, and compare the fit of linear and quadratic models to explain the trend.
a) Data Acquisition: We can utilize data from SIAM (Society of Indian Automobile Manufacturers). Downloading the "Passenger Vehicle Sales by Manufacturer" statistics provides annual sales figures for various companies, including Tata Motors, from 2003 to 2023.
b) Data Analysis:
1) Preprocessing: Ensure data consistency by checking for missing values. If any, consider appropriate imputation methods.
c) Visualization:
1) Create a scatter plot with years (2003-2023) on the x-axis and total sales volumes for Tata Motors on the y-axis.
2) Observe the initial trend and see if any non-linearity is evident.
d) Model Fitting:
1) Linear Model: Use linear regression to estimate the parameters (slope and intercept) for a model of the form:
Sales = a + b * Year
2) Quadratic Model: Use quadratic regression to estimate parameters for a model of the form:
Sales = a + b Year + c Year^2
e) Model Evaluation:
1) Compare the models based on:
i) R-squared: Indicates the proportion of variance explained by the model, with higher values signifying better fit.
ii) Adjusted R-squared: Penalty-adjusted R-squared accounts for model complexity and is preferable for comparing models.
iii) Mean Squared Error (MSE): Measures the average squared difference between predicted and actual sales, with lower values indicating better fit.
f) Interpretation:
1) Analyse the estimated coefficients for both models.
2) For the linear model, the slope signifies the average annual increase in sales.
3) For the quadratic model, the linear and quadratic coefficients describe the rate of change and curvature of the sales trend, respectively.
g) Results and Discussion:
1) Imagine this scenario:
i) The scatter plot reveals an upward trend with some fluctuation but doesn't seem excessively curved.
ii) The linear regression analysis returns an R-squared of 0.75 and an adjusted R-squared of 0.73, while the MSE is 1800 units.
iii) The quadratic regression produces an R-squared of 0.78 and an adjusted R-squared of 0.75, with an MSE of 1650 units.
In this case
a) Both models explain a significant portion of the variance in sales data (R-squared values above 70%).
b) The quadratic model shows a slightly better fit based on R-squared and MSE values, suggesting a non-linearity in the trend, possibly with an acceleration in sales growth in recent years.
c) Interpreting the coefficients would reveal the average annual increase and any acceleration/deceleration in sales based on the quadratic term.
a) Important Note: This scenario and results are hypothetical and can vary depending on the actual downloaded data. The purpose is to illustrate the comparison process and interpretation.
b) Further Exploration:
1) Visualize the residuals (differences between predicted and actual sales) of both models to identify any patterns or outliers.
2) Consider testing other models like cubic or exponential if neither linear nor quadratic models seem sufficient.
3) Analyse the influence of external factors like economic trends, fuel prices, or new car launches on the sales data.
Q5) What is Canonical Correlation Analysis? State the similarity and difference between multiple regression and canonical correlation.
Ans)
Canonical Correlation Analysis (CCA)
Canonical Correlation Analysis (CCA) is a multivariate statistical technique used to explore the relationships between two sets of variables. It identifies linear combinations of variables in each set, known as canonical variables, such that the correlation between these sets of canonical variables is maximized. CCA is particularly useful when dealing with multiple dependent and independent variables and aims to maximize the correlation between the two sets.
Steps in Canonical Correlation Analysis
a) Formulation of Canonical Variables:
1) Two sets of variables are considered: X (independent variables) and Y (dependent variables).
2) Canonical variables are created as linear combinations of the original variables within each set.
b) Maximization of Correlation: Canonical correlation analysis identifies the linear combinations in each set that maximize the correlation between the sets of canonical variables.
c) Canonical Correlation Coefficients: Canonical correlation coefficients are computed, indicating the strength and direction of the relationships between the sets.
d) Significance Testing: Statistical tests, such as Wilks' Lambda, can be used to determine the overall significance of canonical correlations.
e) Interpretation: The canonical loadings and canonical correlations provide insights into the relationships between the original variables in each set.
Similarities Between Multiple Regression and Canonical Correlation
a) Multivariate Techniques: Both multiple regression and canonical correlation are multivariate statistical techniques used to analyse relationships between sets of variables.
b) Regression Structure: Both techniques involve a regression-like structure where one set of variables (dependent in regression, and both sets in canonical correlation) is related to another set of variables (independent in regression, one set in canonical correlation).
c) Linear Combinations: Both techniques involve the creation of linear combinations of variables to express relationships between sets.
d) Correlation Analysis: Both methods are used for analyzing correlations between sets of variables.
Differences Between Multiple Regression and Canonical Correlation (In Tabular Column)

Q6) What is action research? What are the advantages of strategy of action research over conventional research? Illustrate.
Ans)
Action Research
Action research is a research methodology that involves the active participation of researchers, typically practitioners or professionals, in a specific context or setting to identify and address practical issues or problems. The goal of action research is not only to generate knowledge but also to bring about positive change in the real-world setting under investigation. This approach emphasizes collaboration, reflection, and iterative cycles of planning, acting, observing, and reflecting.
Key Characteristics of Action Research
a) Participatory: Involves the active participation of those affected by the research, often including practitioners, community members, or stakeholders.
b) Cyclical Process: Follows a cyclical process of planning, acting, observing, and reflecting, leading to continuous improvement.
c) Problem-Centered: Focuses on addressing specific problems or challenges within a particular context.
d) Contextual: Recognizes and values the context-specific nature of the issues under investigation.
e) Collaborative: Encourages collaboration and dialogue between researchers and practitioners, fostering a shared understanding of the issues.
f) Empowering: Aims to empower individuals and communities by involving them in the research process and decision-making.
Advantages of Action Research over Conventional Research
a) Direct Impact on Practice:
1) Action Research: Provides an avenue for immediate and direct impact on practice. The iterative nature of the process allows for quick adjustments based on real-time feedback.
2) Conventional Research: Findings from conventional research may take longer to be disseminated and applied in practical settings.
b) Responsive to Change:
1) Action Research: Enables adaptability to changing circumstances as researchers and practitioners collaboratively respond to emerging issues.
2) Conventional Research: May struggle to adapt quickly to changes, especially if the research design is fixed and inflexible.
c) Enhanced Stakeholder Engagement:
1) Action Research: Involves stakeholders actively in the research process, fostering a sense of ownership and commitment to the outcomes.
2) Conventional Research: Stakeholder involvement may be limited, with less emphasis on active participation.
d) Contextual Understanding:
1) Action Research: Recognizes and values the unique context of the research setting, leading to more contextually relevant findings.
2) Conventional Research: Findings may be generalized but might lack specificity to particular contexts.
e) Continuous Improvement:
1) Action Research: Emphasizes continuous improvement by cyclically revisiting and refining strategies based on ongoing evaluation.
2) Conventional Research: Typically results in a final report, and revisions may occur after the completion of the study.
f) Promotes Reflection and Learning:
1) Action Research: Encourages reflection on both the process and outcomes, fostering a culture of learning and improvement.
2) Conventional Research: May focus more on reporting findings than on the process of learning.
Illustrative Example
Consider a school that wants to improve student engagement. In action research, teachers and administrators collaboratively identify strategies, implement them, observe changes in student engagement, reflect on the outcomes, and make adjustments accordingly. This iterative process allows for continuous improvement in teaching practices. In contrast, conventional research on student engagement might involve a more detached study, producing findings that may take time to influence teaching practices.
Q7) Write a short note on the following:
Q7 i) Traditional Method and Structural Equation Modelling.
Ans)
Traditional Method
The traditional method refers to conventional or classical approaches in research and statistical analysis. In various disciplines, traditional methods often include standard statistical techniques such as regression analysis, analysis of variance (ANOVA), t-tests, and other parametric or non-parametric tests. These methods are well-established and have been widely used in research for decades. Traditional methods are characterized by their simplicity, ease of interpretation, and applicability to a wide range of study designs. While they have been foundational in many fields, their limitations include assumptions about data distribution and sometimes oversimplification of complex relationships.
Structural Equation Modelling (SEM)
Structural Equation Modelling (SEM) is a sophisticated and comprehensive statistical technique used for analyzing complex relationships among variables. SEM combines elements of factor analysis and multiple regression to examine both observed and latent (unobservable) variables. It allows researchers to model and test intricate networks of relationships, including direct and indirect effects. SEM is particularly useful for testing theoretical models and assessing how well they fit the observed data. It has applications in various fields such as psychology, sociology, economics, and more. SEM offers a powerful framework for understanding the interplay between different constructs in a model and provides insights into the underlying structure of complex systems.
Q7 ii) Input-output table
Ans) An input-output table is a fundamental tool in economics that provides a systematic and comprehensive representation of the inter-industry relationships within an economy. It is a matrix that records the transactions or flows of goods and services between different sectors or industries. The rows of the table typically represent the producing sectors or industries, while the columns represent the consuming sectors.
Key components of an input-output table include
a) Intermediate Inputs: These represent the goods and services that one industry purchases from another as inputs for its production process. They capture the interdependence and interconnectedness of industries.
b) Final Demand: This represents the total demand for the output of each industry, which can be categorized into different types such as consumption, investment, government spending, and exports.
c) Value Added: It represents the value created by each industry in the production process. It is calculated by subtracting intermediate inputs from the gross output of an industry.
Input-output tables serve several purposes
a) Economic Planning: Governments and policymakers use input-output tables for economic planning, assessing the impact of changes in production or demand on different sectors.
b) Multiplier Analysis: Input-output tables facilitate the calculation of economic multipliers, which help estimate the total impact of a change in one sector on the overall economy.
c) Supply Chain Analysis: Businesses use input-output tables to understand and optimize their supply chains, identifying key input suppliers and customer industries.
d) Environmental Analysis: Input-output tables can be extended to environmental input-output tables, allowing for the analysis of environmental impacts associated with different sectors.
e) Trade Analysis: Input-output tables can be used to analyse the effects of international trade on an economy by incorporating information about imports and exports.
Q7 iii) Data generation
Ans) Data generation refers to the process of creating or collecting data for analysis, research, or decision-making purposes. It involves systematically gathering information through various methods to produce a dataset that can be analysed to extract meaningful insights. The quality and relevance of the generated data are crucial for the validity and reliability of subsequent analyses.
Key aspects of data generation include
a) Data Collection Methods: Data can be generated through diverse methods, including surveys, experiments, observations, interviews, focus groups, and automated sensors. The choice of method depends on the research objectives, the nature of the data, and ethical considerations.
b) Sampling: In many cases, it is impractical or impossible to collect data from an entire population. Therefore, researchers often use sampling techniques to select a representative subset of the population. Proper sampling methods ensure that the generated data is reflective of the broader group.
c) Data Variables: Researchers define the variables of interest, specifying what aspects or characteristics are to be measured. This could include quantitative variables like age, income, or temperature, as well as qualitative variables like opinions or preferences.
d) Instrumentation: Researchers use tools, instruments, or technologies to collect data. This could range from traditional paper surveys to sophisticated sensors, depending on the nature of the research.
e) Data Preprocessing: Once collected, raw data may require preprocessing, which includes cleaning, organizing, and transforming the data into a format suitable for analysis. This step ensures data accuracy and consistency.
f) Ethical Considerations: Ethical standards must be adhered to during data generation, protecting the rights and privacy of participants. Informed consent, confidentiality, and transparent data handling are essential elements of ethical data generation.
g) Validation and Verification: Researchers need to validate and verify the generated data to ensure its accuracy and reliability. This may involve cross-checking with other sources or conducting tests for internal consistency.
Data generation is a critical step in the research process, laying the foundation for subsequent analyses and decision-making. The rigor and transparency in the data generation process directly impact the credibility of research findings and the conclusions drawn from the data. Researchers must carefully plan and execute data generation to meet the objectives of their studies and contribute to the advancement of knowledge in their respective fields.'
Q7 iv) Paradigm
Ans) A paradigm, in the context of scientific research, refers to a framework or model that guides and shapes the way researchers perceive, understand, and conduct their investigations within a particular discipline or field of study. It encompasses the set of beliefs, assumptions, theories, methodologies, and practices that define the scientific community's approach to understanding the phenomena under consideration.
Key characteristics of a paradigm include
a) Worldview: Paradigms provide a shared worldview among researchers within a specific scientific community. This worldview dictates how phenomena are perceived, what questions are considered important, and how research should be conducted.
b) Assumptions: Paradigms are built upon a set of foundational assumptions about the nature of reality, the relationship between the researcher and the subject, and the validity of certain methods for acquiring knowledge.
c) Theoretical Framework: Each paradigm is associated with a theoretical framework that guides the formulation of hypotheses, the interpretation of data, and the development of overarching theories within a particular discipline.
d) Methodological Guidelines: Paradigms dictate the methods and research approaches deemed appropriate and valid within a specific scientific community. These methods can include qualitative or quantitative research, experimental or observational designs, and other methodological considerations.
e) Community Consensus: Paradigms operate within a community of researchers who share similar beliefs and adhere to common standards. This consensus helps define what is considered acceptable and credible within that scientific domain.

100% Verified solved assignments from ₹ 40 written in our own words so that you get the best marks!
Don't have time to write your assignment neatly? Get it written by experts and get free home delivery
Get Guidebooks and Help books to pass your exams easily. Get home delivery or download instantly!
Download IGNOU's official study material combined into a single PDF file absolutely free!
Download latest Assignment Question Papers for free in PDF format at the click of a button!
Download Previous year Question Papers for reference and Exam Preparation for free!